
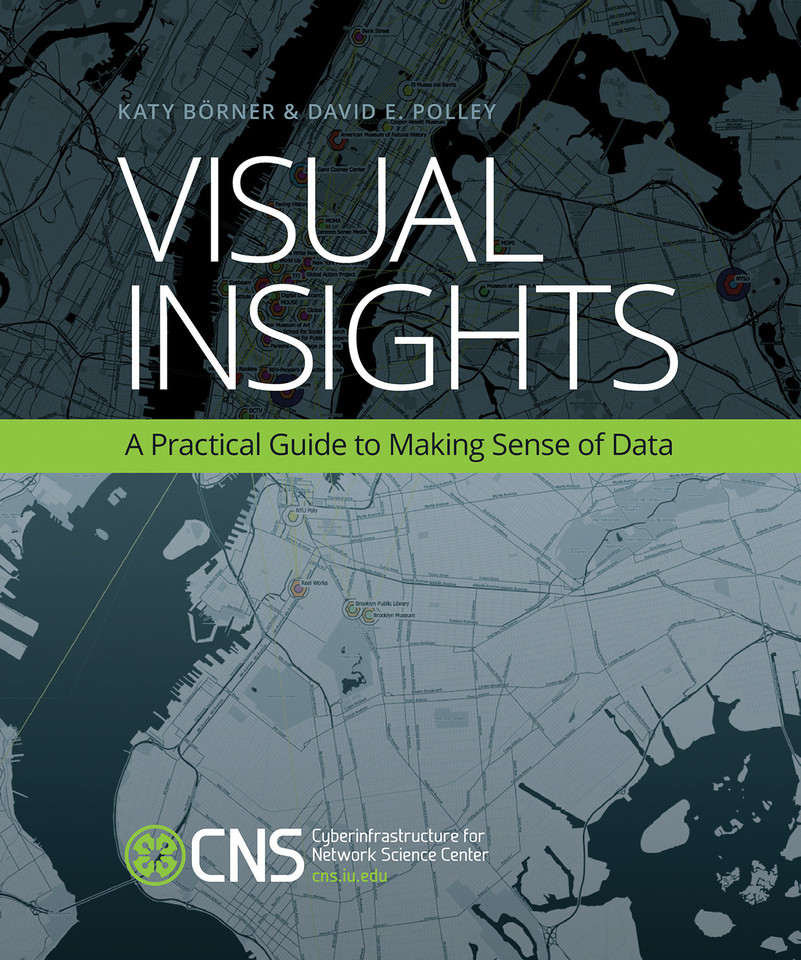
Visual Insights: A Practical Guide to Making Sense of Data
by Katy Börner and David E. Polley
Format
The more copies, the less each one costs
Applied automatically in your cart. No code needed.
Built for school and campus orders
PDF quotes, purchase orders, tax exemption and multi-site delivery, handled by one account manager.
Visual Insights
In the age of Big Data, the tools of information visualization offer us a macroscope to help us make sense of the avalanche of data available on every subject. This book offers a gentle introduction to the design of insightful information visualizations. It is the only book on the subject that teaches nonprogrammers how to use open code and open data to design insightful visualizations. Readers will learn to apply advanced data mining and visualization techniques to make sense of temporal, geospatial, topical, and network data.
The book, developed for use in an information visualization MOOC, covers data analysis algorithms that enable extraction of patterns and trends in data, with chapters devoted to “when” (temporal data), “where” (geospatial data), “what” (topical data), and “with whom” (networks and trees); and to systems that drive research and development. Examples of projects undertaken for clients include an interactive visualization of the success of game player activity in World of Warcraft; a visualization of 311 number adoption that shows the diffusion of non-emergency calls in the United States; a return on investment study for two decades of HIV/AIDS research funding by NIAID; and a map showing the impact of the HiveNYC Learning Network.
Visual Insights will be an essential resource on basic information visualization techniques for scholars in many fields, students, designers, or anyone who works with data.
The book, Visual Insights: A Practical Guide to Making Sense of Data [Bulk, Wholesale, Quantity] ISBN#9780262526197 in Paperback by Katy Börner, David E. Polley may be ordered in bulk quantities. Minimum starts at 25 copies. Availability based on publisher status and quantity being ordered.
Details
- Publisher
- MIT Press
- Authors
- Katy Börner, David E. Polley
- Format
- Paperback
- Published
- Jan 24, 2014
- ISBN-13
- 9780262526197
- ISBN-10
- 0262526190
- Pages
- 312
- Carton quantity
- 10 copies
Visual Insights in bulk: pricing
Volume pricing applies automatically in your cart. No codes, no account needed.
| Copies | Price per copy | You save |
|---|---|---|
| 25 – 49 | $38.40 | 4% off list |
| 50 – 99 | $38.00 | 5% off list |
| 100+ | $37.60 | 6% off list |
Popular for
A copy for every student in the class or section.
Shared reading for professional development.
Common reads and first-year programs.
How fast can I get copies of Visual Insights?
Need them by a specific date? Request a quote and we'll confirm timing before you pay.
Can you ship to several locations or people's homes?
Yes. We ship in bulk to one address, to multiple sites, or to individual recipients, in the US and internationally. See fulfillment options.
Can I get a formal quote for approval before ordering?
Yes. Request a quote and we'll send a PDF you can forward for approval.
Do you accept purchase orders and tax-exempt orders?
Yes. We accept purchase orders upon approval, as well as cards, PayPal, ACH, wire transfers and checks. BookPal is a tax-exempt supplier in all 50 states. See purchase orders and sales tax exemption.
What if I find a lower price?
Send us the link. We match prices from other bulk booksellers and distributors on a new copy in the same edition, available to ship in the quantity you need. Clearance sales and pricing errors are the exception, and we'll tell you quickly if that's the case. Start a price match.
What buyers say
Write a Review
Visual Insights: A Practical Guide to Making Sense of Data [9780262526197]
Groups also order




A colleague asked you to approve this order
Your quote list
Add books as you browse, then request one quote for all of them.